 The Kinnickinnic River begins its journey in the agricultural landscapes east of Roberts and Hammond, WI, an area now at the heart of a new groundwater protection initiative led by St. Croix County Land and Water Conservation, with funding from the USDA National Water Quality Initiative (NWQI). Nitrate levels in municipal wells in this area have been rising over the past 25 years, and many private wells already exceed safe drinking water standards. In an effort to protect the groundwater in this area, the County will develop a protection plan which will evaluate existing nitrogen best management practices (BMPs) that could be cost shared using USDA programs.
Project Area:
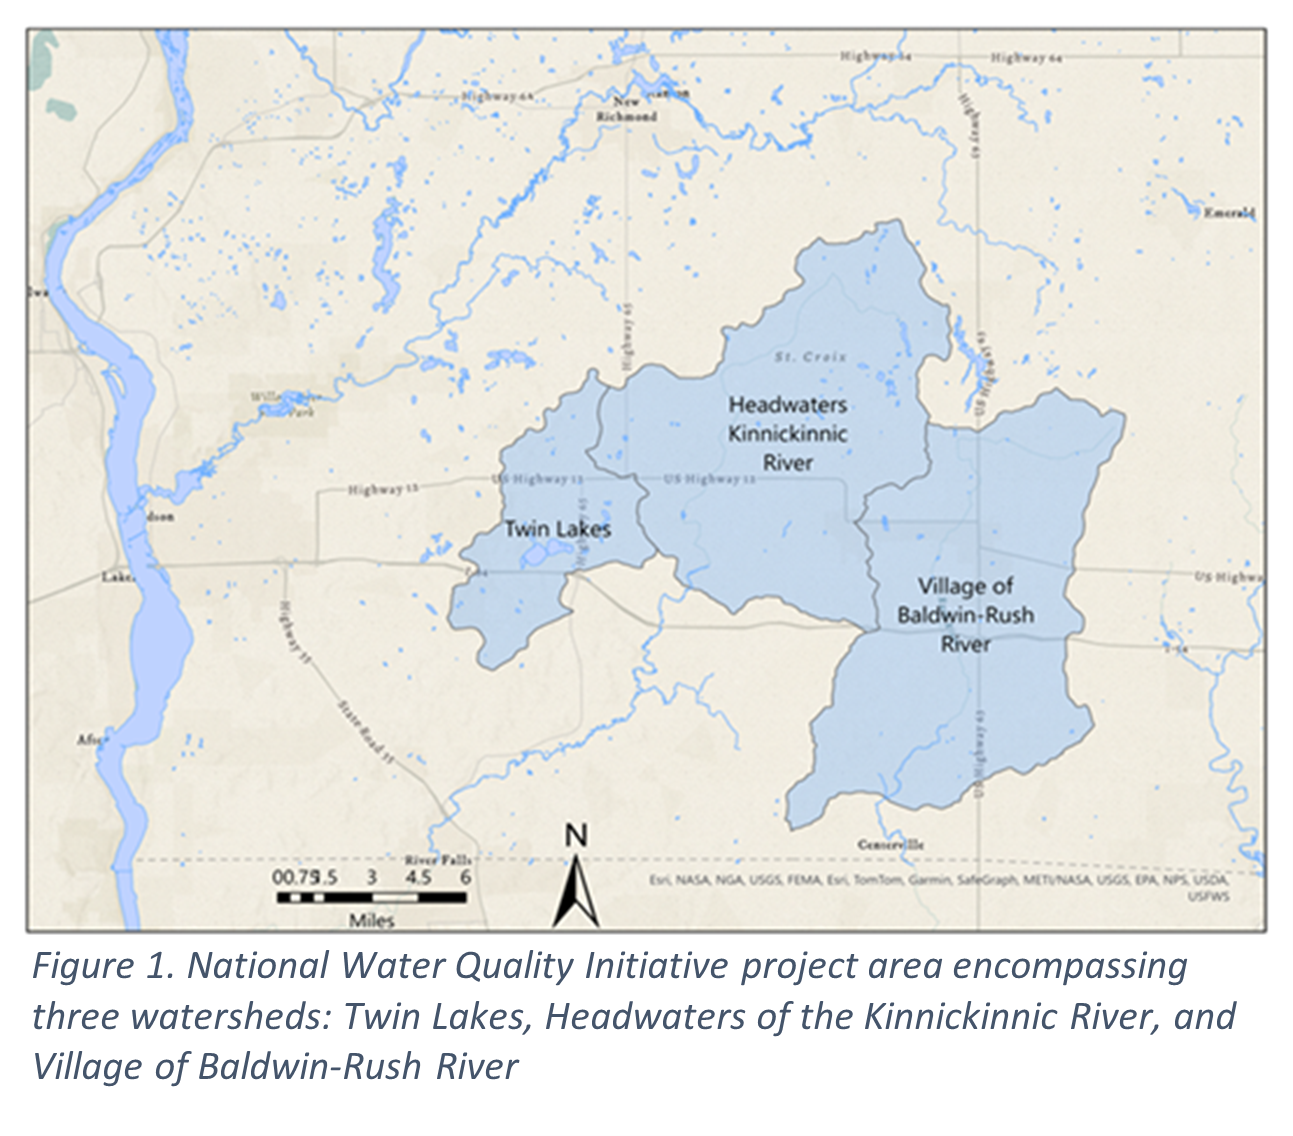
Three HUC-12 watersheds are covered in the project (Twin Lakes, Headwaters, Baldwin-Rush River), encompassing approximately 67,000 acres, primarily in the Towns of Warren, Hammond, Erin Prairie, and Baldwin (Figure 1). Natural springs in this area form the headwaters of the Kinnickinnic River, a Class I trout stream, and recharge the aquifer that supplies drinking water to the Village of Roberts and Hammond.
Over the past 25 years, nitrate-nitrogen levels in municipal wells in this area have gradually increased but remain below the 10 ppm drinking water standard (Figure 2). However, 24% of private wells in the area already exceed this standard, reflecting the vulnerability of groundwater in this region (Table 1).
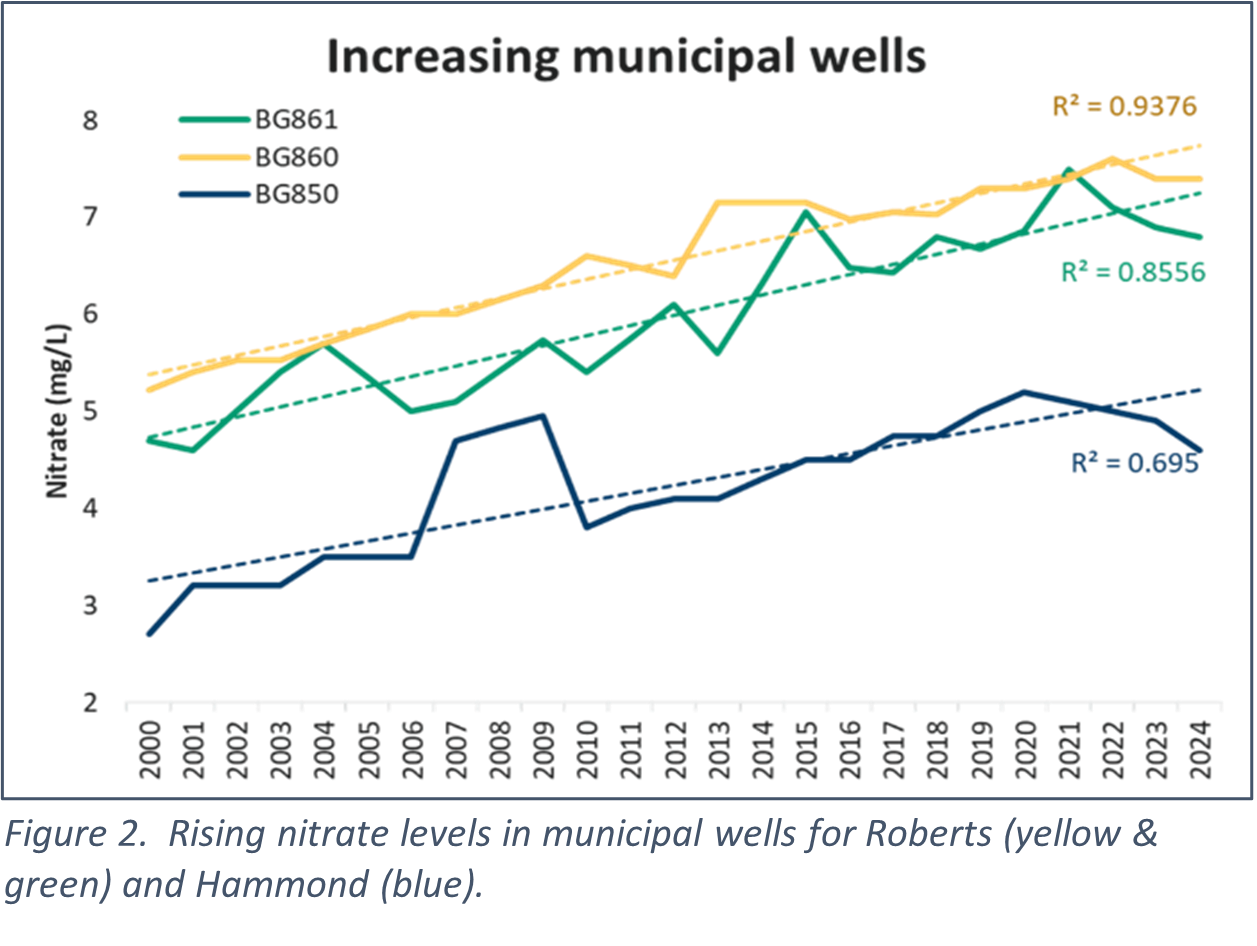
Table 1. Kinnickinnic Headwaters Nitrate-N data from 619 private wells over the past 25 years.
HUC-12 (# samples)
| Average Nitrate (ppm)
| Percentage Exceeding 10 ppm Standard
|
|---|
Twin Lakes (n = 171) | 7.27 | 32.2% |
Headwaters (n = 205) | 9.33 | 38.5% |
Baldwin/Rush River (n = 243) | 4.73 | 6.2% |
TOTAL (n = 619) | 6.96 | 24.1% |
Project Outline:
- Use existing groundwater data to determine nitrate loading.
- Develop a nitrogen budget for the project area that explains nitrate loading. Use the developed budget tool to determine the level of nitrogen leaching reduction needed to safeguard drinking water.
- Evaluate nitrogen load reduction scenarios that implement known BMP’s such as cover crops, crop rotation, and nitrogen fertilizer management to determine the impact of stacking these practices.
- Calculate the necessary funding required to implement BMP’s at a scale sufficient to protect groundwater.
- Develop an outreach and education plan to reach landowners and producers.
Results
Nitrogen load for the Upper Prairie du Chien aquifer in the Roberts/Hammond area was calculated using 619 domestic well test results. Aquifer recharge was assumed to equal discharge. Five years of land use data (2020-2024) was used to develop a nitrogen budget reflecting current conditions (Table 2). The total nitrogen load for the baseline HUC-12 area budgets were within 0.4% to 2.5% of that calculated using groundwater data (Table 3).
Table 2. Nitrogen load calculation based on known well nitrate concentrations.
HUC-12
| Average Nitrate (ppm)
| Land Area (acres)
| Lbs Per Acre Delivered in 7ac-in Water
| Annual Load for entire HUC-12 Area (Lbs/year)
|
|---|
Twin Lakes | 7.27 | 9,686 | 11.53 | 111,712 |
Headwaters | 9.33 | 28,768 | 14.80 | 425,644 |
Baldwin/Rush River | 4.73 | 28,673 | 7.50 | 215,112 |
TOTAL | 6.96 | 67,130 ac | Avg = 11.2 lbs/ac | 752,467 |
Table 3. Baseline nitrogen budget for Kinnickinnic Plan area.
| Leaching Source | Twin Lakes HUC 12 | Headwaters HUC 12 | Baldwin-Rush River HUC 12 | Total Leached | Percent Contribution |
|---|
| - - - - - lbs/ per HUC 12 Per year - - - - - | % |
Corn | 86,739 | 303,259 | 157,691 | 547,690 | 71.9% |
Soybean | 12,753 | 51,623 | 14,998 | 79,374 | 10.4% |
Alfalfa, grassland, other crops | 1,45Nitrates 5 | 3,889 | 2,831 | 8,175 | 1.1% |
Manure Application | 2,112 | 48,664 | 31,080 | 81,856 | 10.7% |
Septic System Leaching | 7,340 | 17,580 | 11,280 | 36,200 | 4.8% |
Septage Application | 901 | 2,620 | 420 | 3,941 | 0.5% |
Lawn Fertilizer | 848 | 1,870 | 2,132 | 4,850 | 0.6% |
Nitrogen Load Estimate | 112,148 | 429,505 | 220,431 | 762,085 | 100.0% |
Calc. From Water Samples | 111,712 | 425,644 | 215,112 | 752,468 | |
Comparison | 100.4% | 100.9% | 102.5% | 101.3% | |
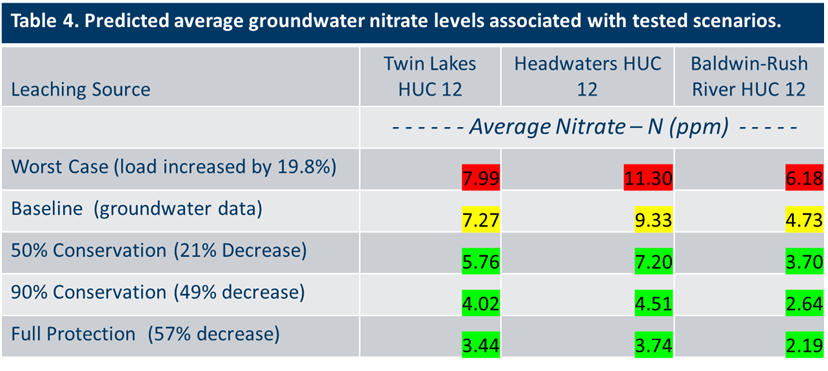
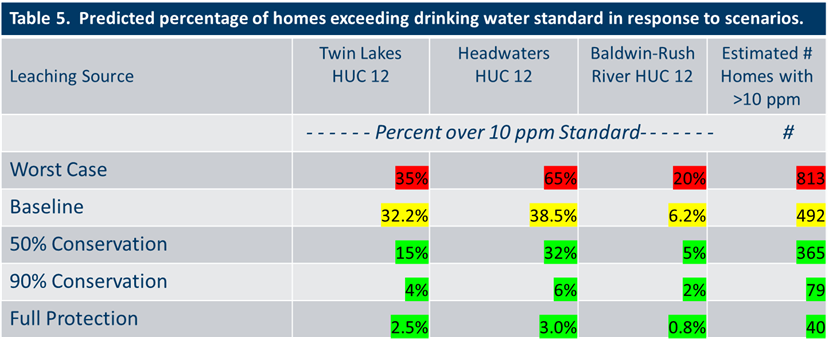
Nitrogen Load Scenarios Evaluated
- Worst Case – Adjustments were made to baseline to reflect the possibility of an increase in corn acres (+10%), an increase in manure application (2X), and an increase in the number of homes (+10% homes)
- Baseline – existing conditions and balanced closely to groundwater loading (Table 3).
- 50% Conservation – Adjustments were made to baseline to show the impact of 50% adoption of nitrogen BMP’s, 50% adoption of lower manure rates, and 50% adoption of cover crops following soybeans.
- 90% Conservation – Adjustments were made to baseline to show a 90% adoption of BMPs.
- Full Protection – Adjustments were made to baseline to show 100% BMP adoption. In addition, 1,500 acres of land in sensitive areas would be taken out of production and enrolled in the Conservation Reserve Program (CRP
Conclusions
The baseline nitrogen budget accurately represents current groundwater nitrate concentrations. The Twin Lakes and Kinnickinnic Headwaters watersheds are particularly susceptible to nitrate leaching than other areas of the County. This is largely due to a higher percentage of sandy soils (over 20%), and shallow depth to bedrock and groundwater. Therefore, while agricultural practices in the project area are similar to those elsewhere in the County, the local soils and geology contribute to greater nitrate loss. Implementing agronomic BMPs to reduce nitrogen leaching is a feasible and effective strategy for improving groundwater quality. Modeling results indicate that implementing the 50% Conservation scenario would cost ~$300k per year to cover cost-share assistance, technical support, outreach, and monitoring for the Twin Lakes and Kinnickinnic Headwaters HUC-12 areas.